Hook rate and hold rate on Meta: find a video's weak spot with two numbers

Hook rate shows whether a video's opening stops people; hold rate shows whether the story keeps them. Here are the formulas, how to calculate both metrics in Ads Manager and what to do with each combination of numbers.
What are hook rate and hold rate?
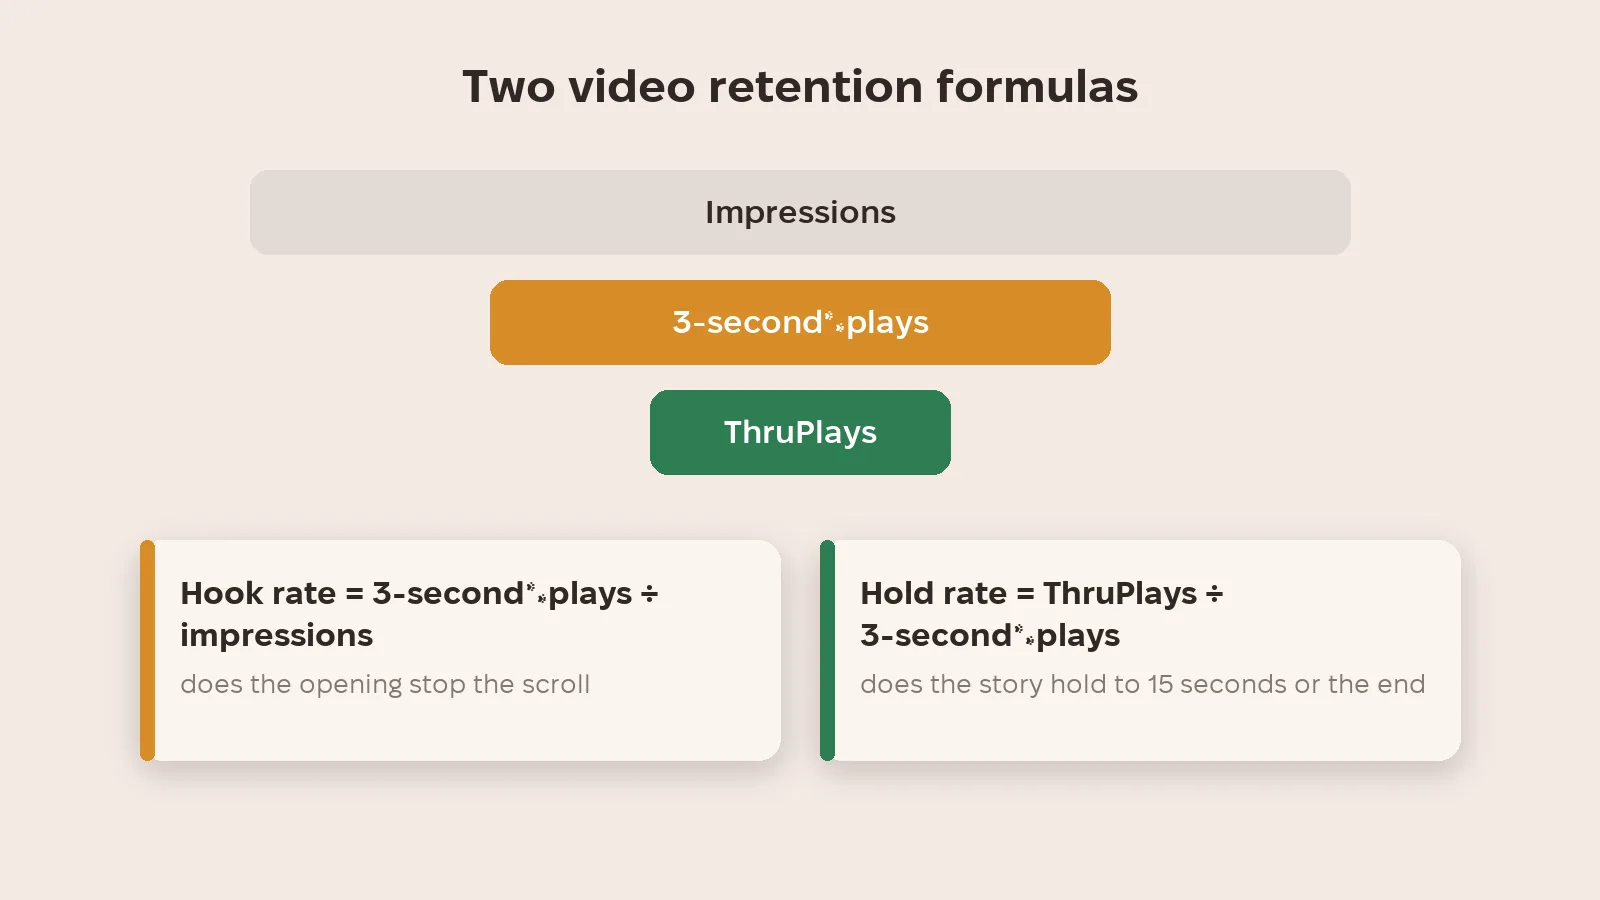
Both metrics come from data Meta already reports. Hook rate is 3-second video plays divided by impressions: the share of people who stopped on the video. Hold rate is most often ThruPlays divided by 3-second plays: how many of those who stopped kept watching. A ThruPlay is a play to completion or for at least 15 seconds.
What do the numbers tell you?
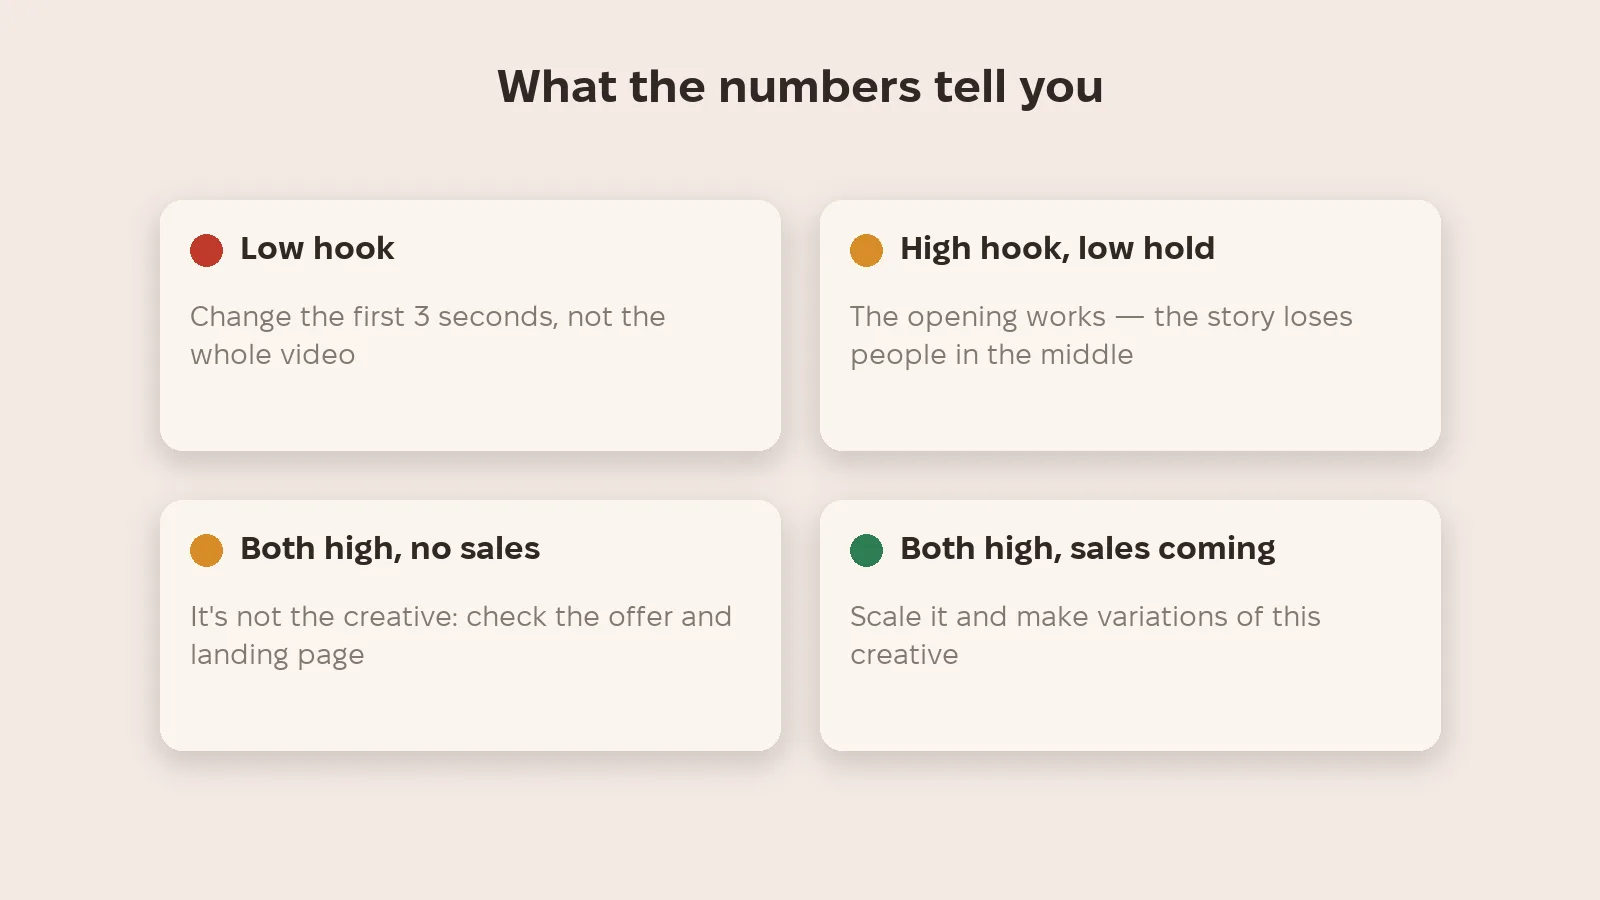
Low hook means the problem is in the first three seconds: change the opening, not the whole video. High hook and low hold means the opening grabs people but the story loses them in the middle. Both high but no sales means it's no longer the creative: check the offer and the landing page.
Are these columns in Ads Manager?
Some advertisers already see Hook rate and Hold rate columns in Ads Manager, but Meta hasn't announced them and they aren't available to everyone. If you don't have them, create a custom metric: Columns → Customize columns → Create custom metric, and build the formula from 3-second plays, ThruPlays and impressions.
What to keep in mind
Formulas differ between tools: hold rate is sometimes based on 75% plays or average watch time, so only compare like with like. For long videos a ThruPlay means 15 seconds, not the whole video. Public hook rate "benchmarks" come from individual vendors, not Meta: compare your creatives against each other in your own account.
How to start
- Add the metrics: check for Hook rate and Hold rate columns; if they're missing, create custom metrics with the formulas above.
- Compare creatives within one campaign and over the same period.
- Weak hook — rework the first 3 seconds: a different first frame, a question or movement at the start.
- Weak hold — cut the middle and show the key point sooner.
- Both high but no sales — look further down the funnel: offer, price, landing page.
Metriverra shows Meta ad results next to sales, so you can check whether a creative with a strong hook actually brings orders.
In short
- Hook rate = 3-second plays ÷ impressions — does the opening stop people.
- Hold rate = ThruPlays ÷ 3-second plays — does the story hold them.
- Low hook → change the first 3 seconds; low hold → the middle.
- Both high with no sales → the problem is the offer or landing page.
- Meta publishes no official benchmarks — compare creatives against each other.
Sources: Meta for Developers — Insights API · MarTech — What counts as a video view