Features

Everything you need to make marketing decisions

Six working areas in one window. Each runs on real data from your accounts — no demo placeholders and no made-up numbers.

01 · Dashboard

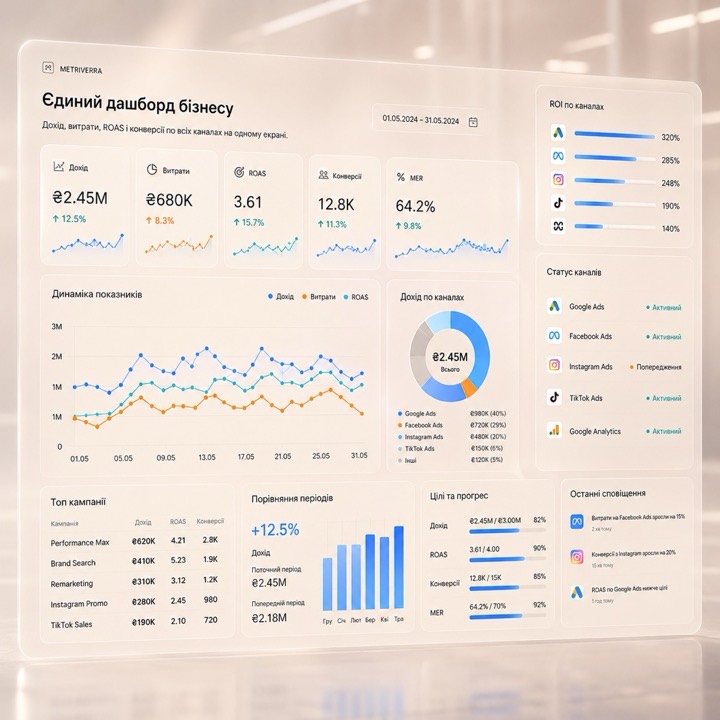
One business dashboard

Revenue, spend, ROAS and conversions across every channel on one screen. Derived metrics — MER, ad cost share, site conversion — are calculated for you, so there is no reconciling numbers by hand.

  • Revenue, spend and ROAS across all channels together
  • MER and ad cost share calculated automatically
  • Period comparisons and day-over-day trends
  • One metric standard for every project
SCREENSHOT: Dashboard
02 · Budget

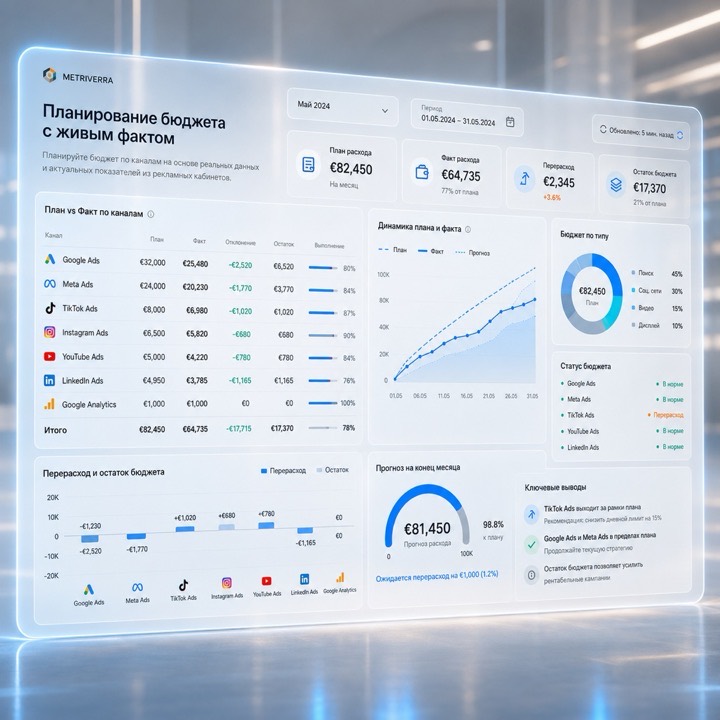
Budget planning with live actuals

Set a plan by channel and actual spend flows in on its own from your accounts. Overspend, remaining budget and the pace to month-end are visible at a glance — no separate spreadsheet.

  • Plan versus actual for every channel
  • Live spend from Google Ads and Meta
  • Overspend and remaining budget in plain sight
  • Unlimited breakdown rows
SCREENSHOT: Budget
03 · SEO & Search

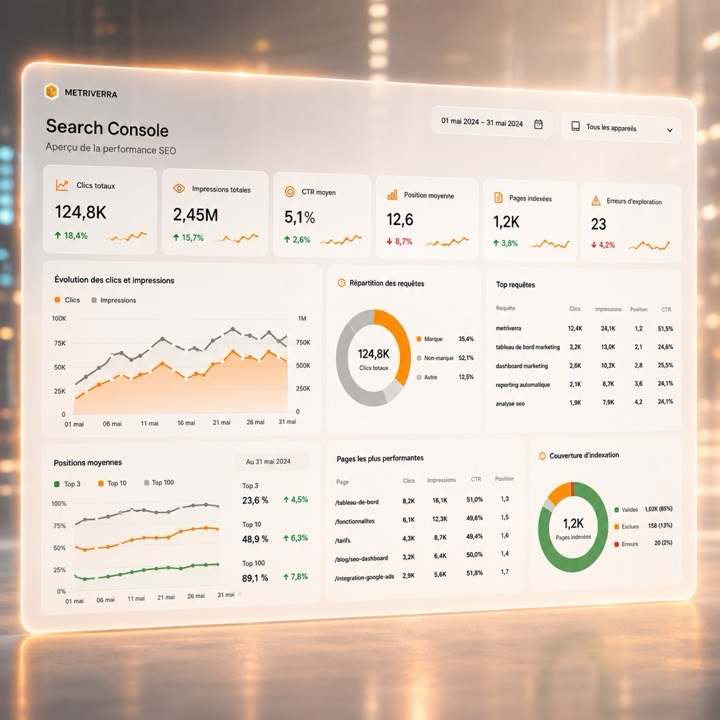
Search Console, cleaned up

Queries, positions, impressions and CTR from Search Console, gathered into readable reports. Brand versus non-brand, rising and falling positions — with no manual CSV exports.

  • Queries, positions, impressions and CTR
  • Brand versus non-brand split
  • Position trends over the period
  • Pages and queries that slipped
SCREENSHOT: SEO
04 · Competitors

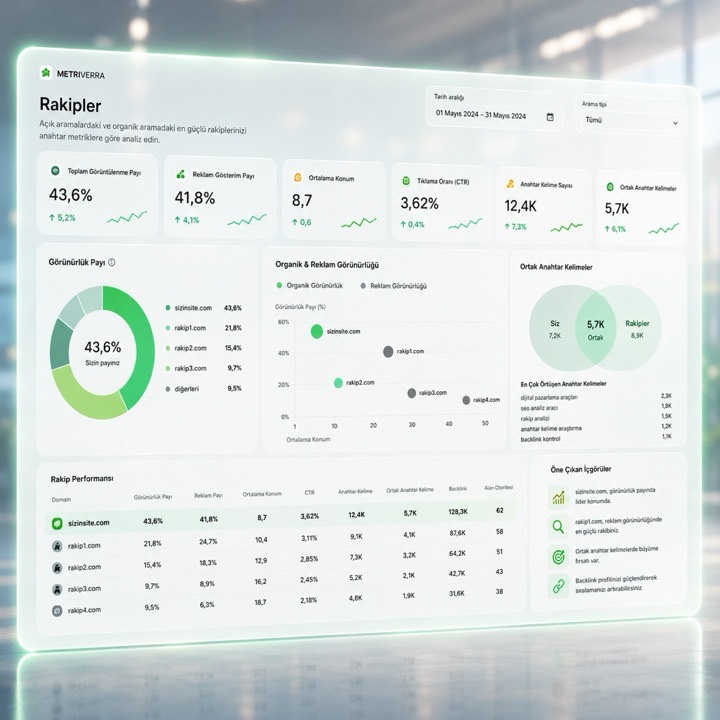
Who shares your auctions and organic results

From DataForSEO you can see who competes with you in paid results and in organic search, on which queries, and how often you overlap.

  • Competitors in Google Ads auctions
  • Overlap in organic results
  • Shared keyword queries
  • Impression share alongside competitors
SCREENSHOT: Competitors
05 · Product feed

Merchant Center health

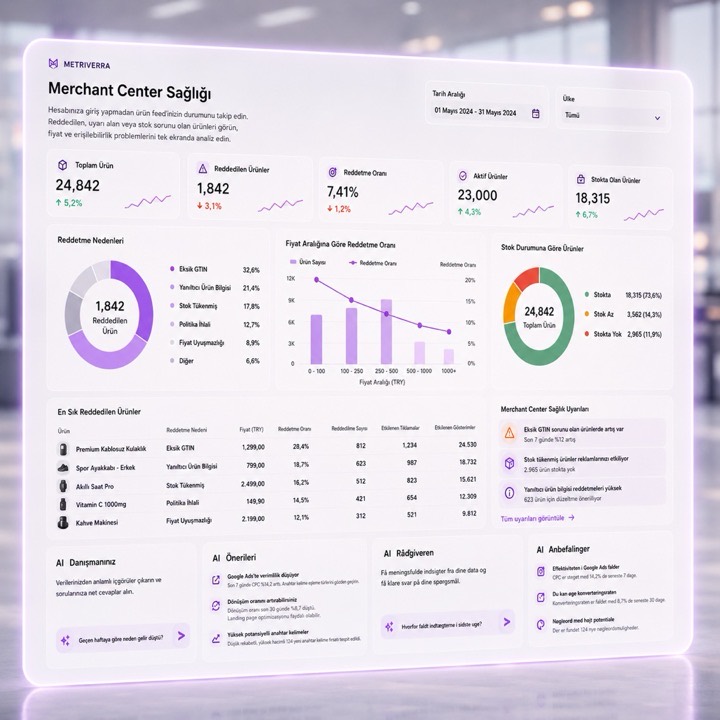
The state of your product feed without opening the account: how many products are disapproved, the reasons, prices and availability. Problems are visible before they eat your budget.

  • Disapproved products and rejection reasons
  • Prices and availability across the feed
  • Share of active products
  • Feed problems on a single screen
SCREENSHOT: Feed
06 · AI advisor

Explanations in plain language

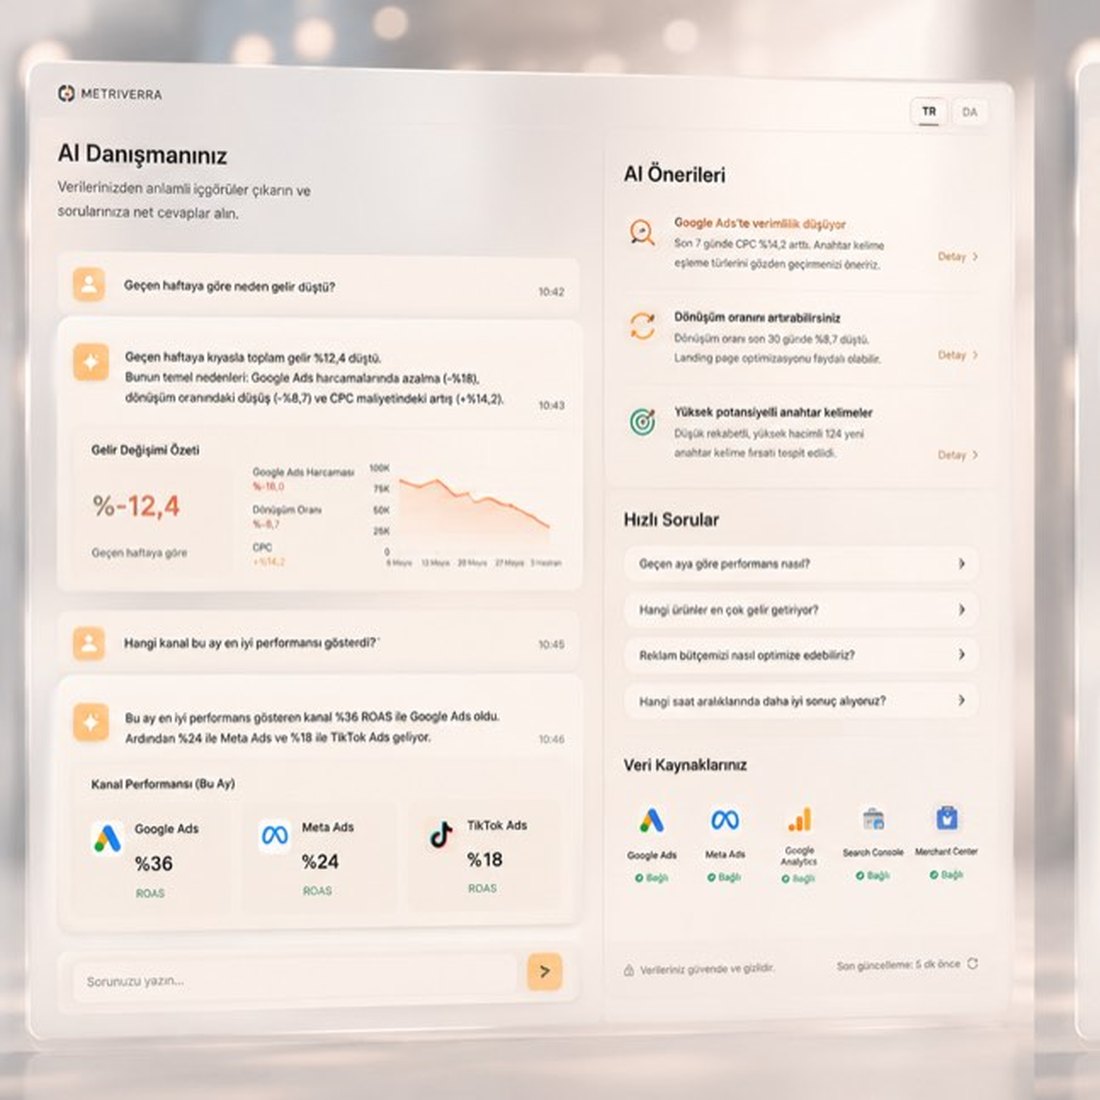
Ask “why did revenue drop last week?” and get an answer from your real data, with specific channels and numbers — not generic advice from the internet.

  • Answers from your real data
  • Metrics explained in plain language
  • Hints on what to look at next
  • No made-up numbers and no “roughly”
SCREENSHOT: AI advisor
Demo

Want to see this on your own data?

Request a demo — we’ll show every area on your accounts.